Research
Two connected programs
Research
In Drosophila ovaries and wing discs, the Kalderon Lab studies how spatial signals regulate follicle stem-cell division and differentiation, and how Hedgehog-dependent phosphorylation activates the Ci transcription factor.
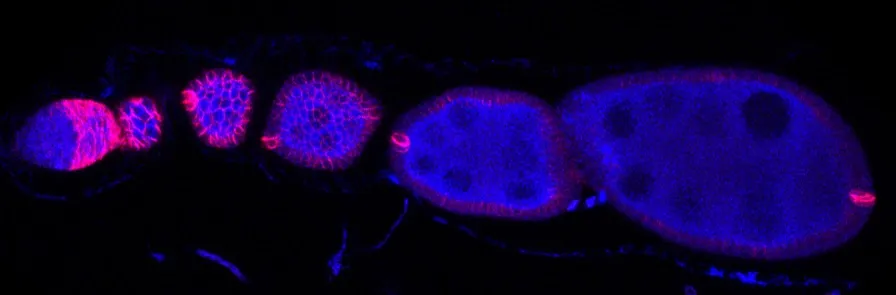 An ovariole, from germarium to egg chambersHow does location alter what a stem cell does?
Follicle stem cells occupy different anterior–posterior positions, exchange locations, and divide at different rates within one dynamic community. The lab studies how spatial signals coordinate division and differentiation across that community.
Explore adult stem cells 02 / Hedgehog signaling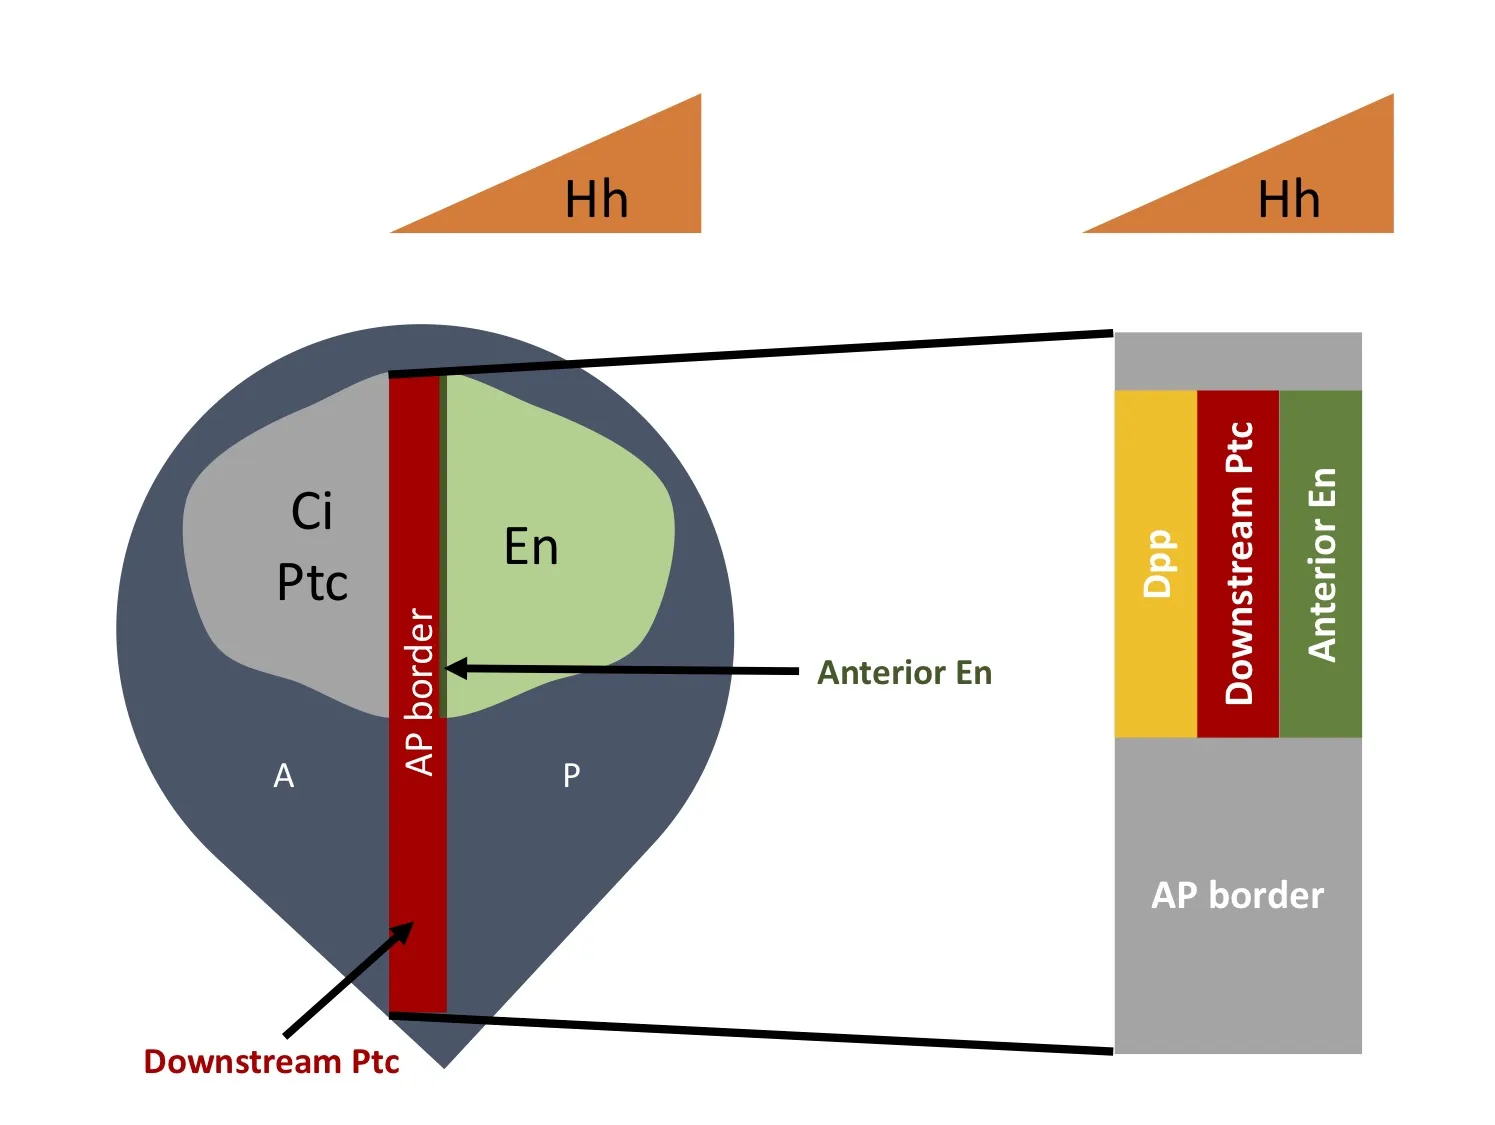 A gradient across the wing discHow does a signal become transcriptional activity?
Hedgehog signals act through Smoothened and Fused to change Ci activity. The lab tests how phosphorylation and protein interactions convert pathway input into transcriptional output.
Explore hedgehog signalingResearch / Adult stem cells
A lifetime of replacing cells.
Key idea
The fly ovary makes tissue renewal accessible to lineage tracing, genetics and live imaging.
An ovariole, from germarium to egg chambers
What you are seeing
Egg development proceeds along an ovariole. DAPI marks nuclei in blue; Fas3, shown in red, marks the follicle-cell epithelium.
Image source
How follicle stem cells renew tissue
Embryonic stem cells can generate the diverse cell types of the developing body. Adult stem cells instead sustain particular tissues throughout life, including the continually renewed human gut lining and blood.
In the fly ovary, follicle stem cells (FSCs) supply the somatic cells that support developing eggs: follicle cells (FCs) coat egg chambers, while escort cells (ECs) support earlier germ cells. Germline stem cells are a separate population that supplies the egg-producing lineage.
Orient yourself in the ovary
An ovariole is one of the egg-producing tubes in an ovary. Its anterior tip, the germarium, contains the stem-cell populations. Developing egg chambers leave toward the posterior. A stem-cell niche is the local environment that supports stem-cell behavior.
Research / Adult stem cells
Stable numbers. Changing lineages.
Key idea
Renewal is balanced across a population, even as the identities of its members change.
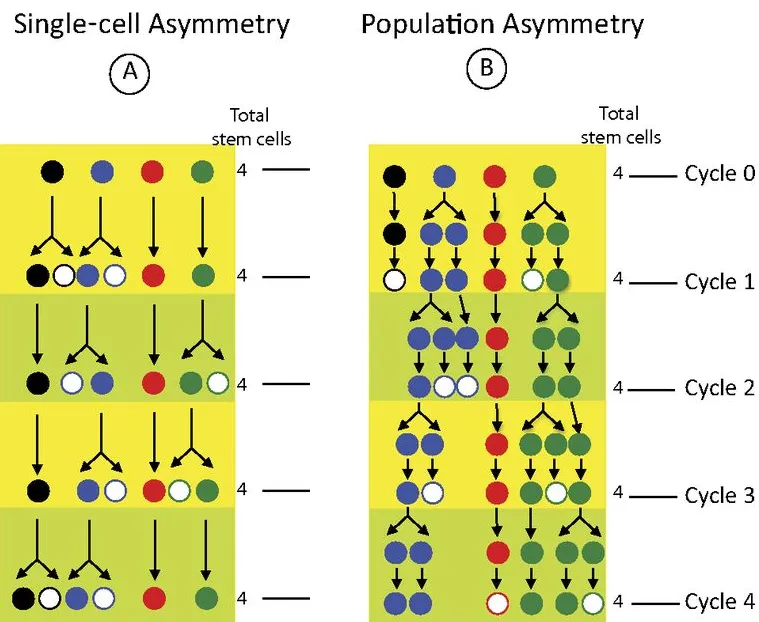
Two ways to maintain a stem-cell population
What you are seeing
Colored cells denote stem-cell lineages; white cells have differentiated. The population can persist while individual lineages disappear. This is a conceptual diagram.
Image source
How a population stays balanced
With single-cell asymmetry, each division produces one stem cell and one differentiating daughter. With population asymmetry, balance emerges across the whole community: some stem-cell lineages expand while others disappear by chance.
The lab’s FSC studies support this population model. Division and differentiation can occur independently, so a stem cell can leave the pool by differentiating without first dividing. A stable population does not require every original stem cell to remain.
Research / Adult stem cells
Watch the diversity of lineages narrow.
Key idea
A shrinking set of lineage colors reveals turnover within a maintained stem-cell pool.
Following six possible lineage colors
What you are seeing
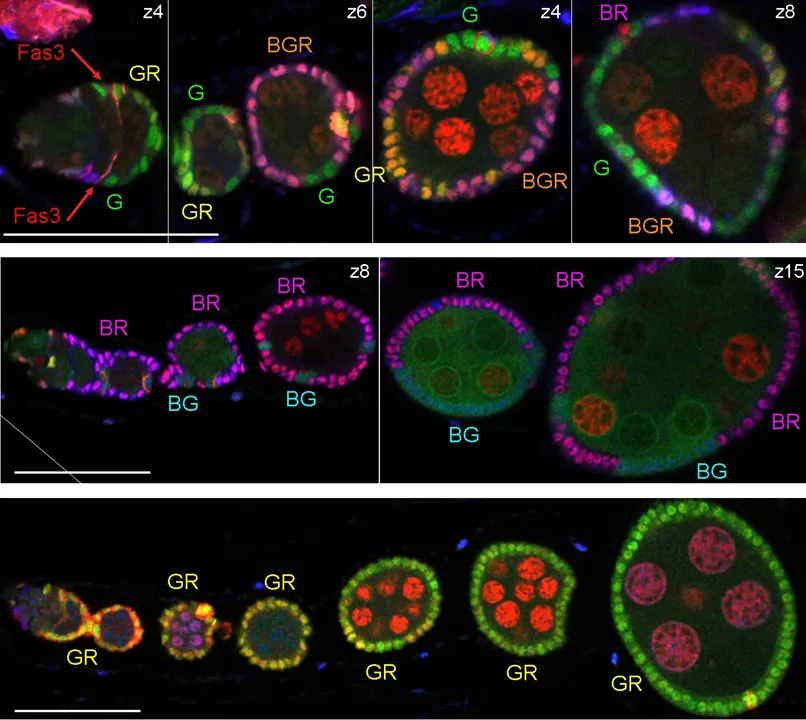
The six-color labeling system distinguishes descendants of labeled FSCs. Rows show separate samples after label induction, with the original labels and scale bars retained.
Image source & panel notes
9 days The top row shows multiple lineage colors remaining nine days after induction.
21 days The middle row illustrates fewer surviving lineage colors after 21 days.
30 days The bottom row illustrates one lineage color dominating after 30 days. Loss and expansion are stochastic across the population.
The montage compares samples collected at different times after labeling; it does not follow one living germarium continuously. The row selector only highlights the original panels.
What the lineage experiments show
A labeling system with six possible color combinations lets researchers distinguish FSC lineages and their descendants. If each original lineage always replaced itself, the number of colors would stay comparatively stable.
Instead, the examples at 9, 21 and 30 days show progressive loss of lineage diversity. Some lineages disappear as surviving lineages expand—evidence for population asymmetry. Select a timepoint to locate its row in the original figure.
What a lineage color can tell us
A lineage is a labeled cell and its descendants. Researchers score both FSCs retained in the niche and differentiated descendants. Six possible labels help resolve multiple lineages, but a shared color is not a unique molecular barcode.
Research / Adult stem cells
Division changes the odds of staying.
Key idea
Division rate can influence competition for a place in the stem-cell community.
Division and niche occupancy
What you are seeing
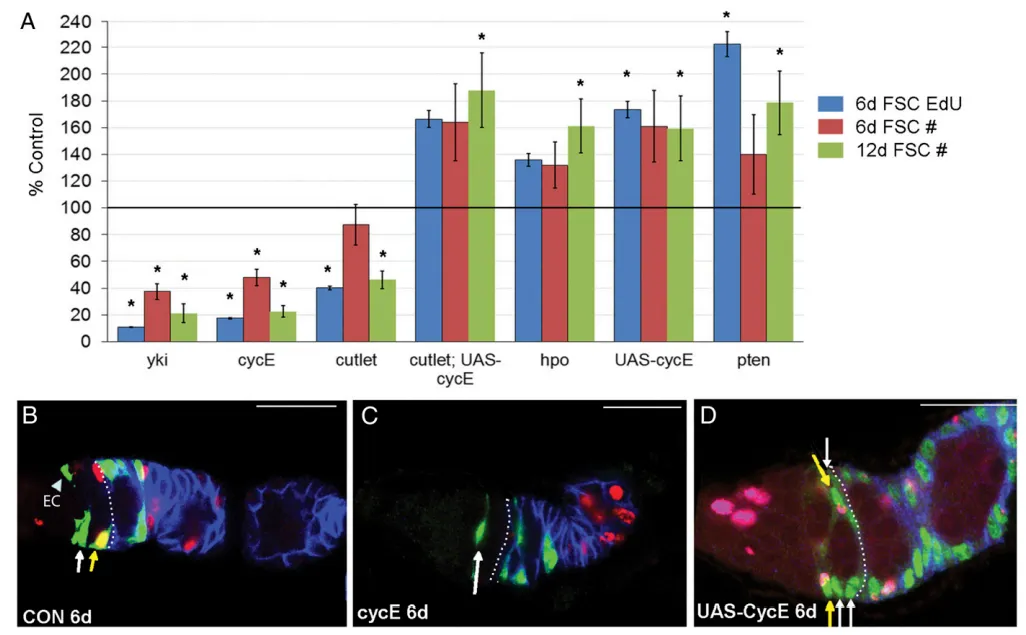
Graph: blue, EdU at 6 days; red, FSC number at 6 days; green, FSC number at 12 days. Values are relative to control. In the microscopy panels, EdU is red.
Image source
An EdU-positive fraction is a snapshot of S-phase occupancy. It is not itself a count of divisions per hour; interpreting it as cycling speed requires knowing how long S phase lasts. The live cell-cycle measurements address this limitation.
How division changes niche competition
When differentiation can occur independently of division, a slower-dividing lineage has fewer opportunities to replace the stem cells it loses. Faster division can shift niche occupancy in a lineage’s favor.
The lab tested this by altering proliferation genetically. Slow-dividing yki, cycE and cutlet lineages were depleted, while faster-dividing hpo, elevated Cyclin E and pten lineages accumulated. Counts of marked FSCs at 6 and 12 days connected proliferative activity with retention.
Reading the proliferation experiment
EdU is incorporated during DNA synthesis, identifying cells in S phase. The graph compares EdU labeling at day 6 with marked FSC numbers at days 6 and 12, each relative to control.
Research / Adult stem cells
One community, opposing signals.
Key idea
Position changes the signals a cell receives—and its opportunities to divide or differentiate.
Where the FSC community sits
What you are seeing
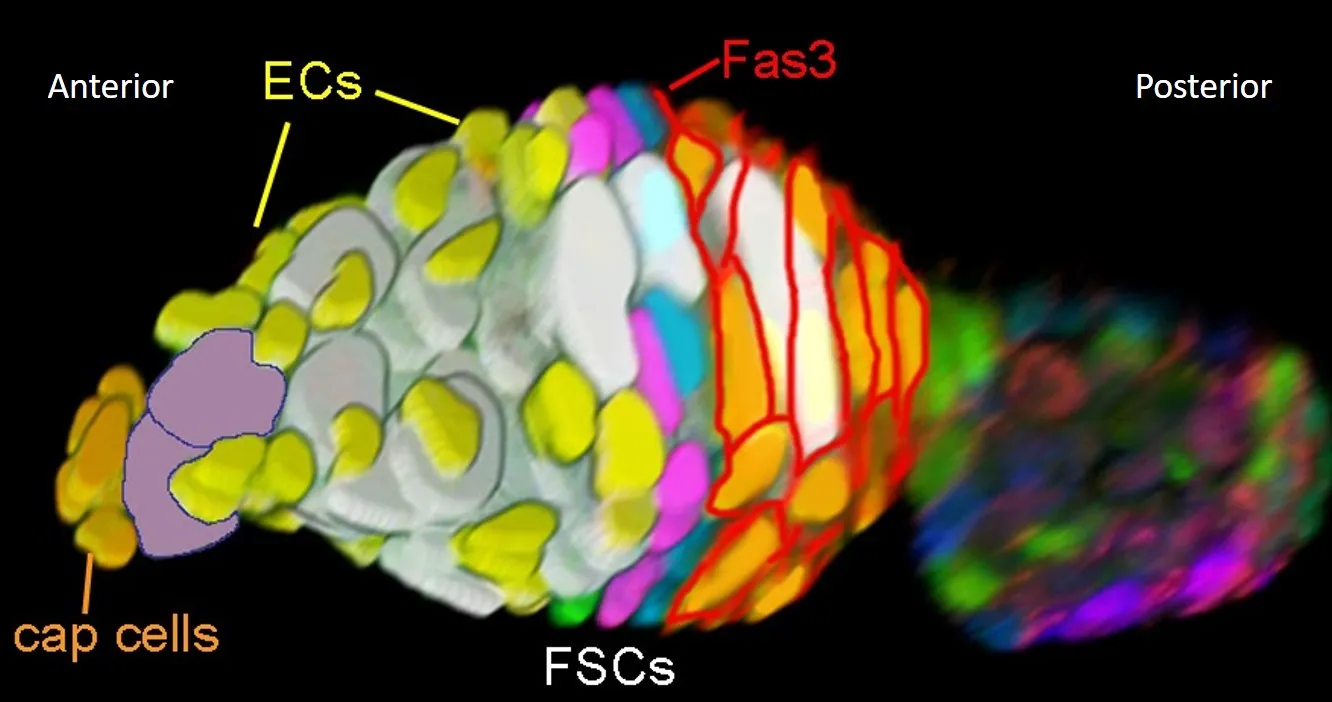
This annotated reconstruction places FSCs between anterior escort cells and posterior follicle cells. It is a separate specimen from the live-imaging dataset.
Image source
How position and signals shape cell behavior
FSCs occupy roughly three anterior–posterior layers and can exchange positions. Anterior cells favor escort-cell production; posterior cells directly supply follicle cells. The arrangement is mobile, with approximately 14–16 FSCs in the lab’s population model.
Two graded signals help organize these differences. Wnt activity is higher anteriorly and strongly influences position and escort-cell production. JAK–STAT activity is higher posteriorly and strongly influences proliferation and follicle-cell production. Both pathways affect multiple aspects of FSC behavior.
| Position | Layer | EdU-positive fraction |
|---|---|---|
| Anterior | 3 | 8.2% |
| Middle | 2 | 20.0% |
| Posterior | 1 | 33.4% |
Control GFP-marked FSC clones, 6 days after induction: 4,753 FSCs scored in total (Melamed and Kalderon, 2020, Figure 2A). These fractions measure S-phase occupancy, not divisions per hour or invariant properties of each layer.
See the Wnt and JAK–STAT perturbations
The two pathways can be tested separately. stat loss and elevated Hop compare low and high JAK–STAT activity; arr and axn mutations compare low and high Wnt activity. Their distinct effects link signal input to position, lineage output and proliferation.
Changing JAK–STAT activity
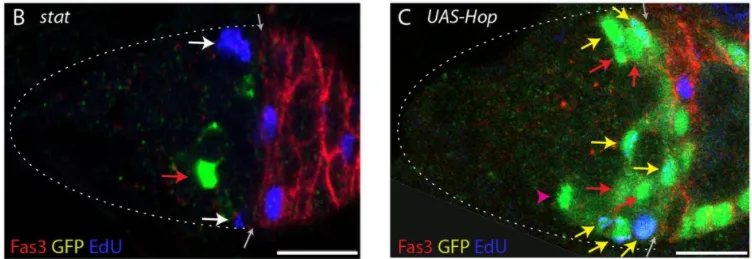
Removing STAT reduces proliferation and lineage retention. Elevated Hop, a JAK kinase, increases proliferation and the number of marked FSCs. EdU is blue in this figure.
Changing Wnt activity
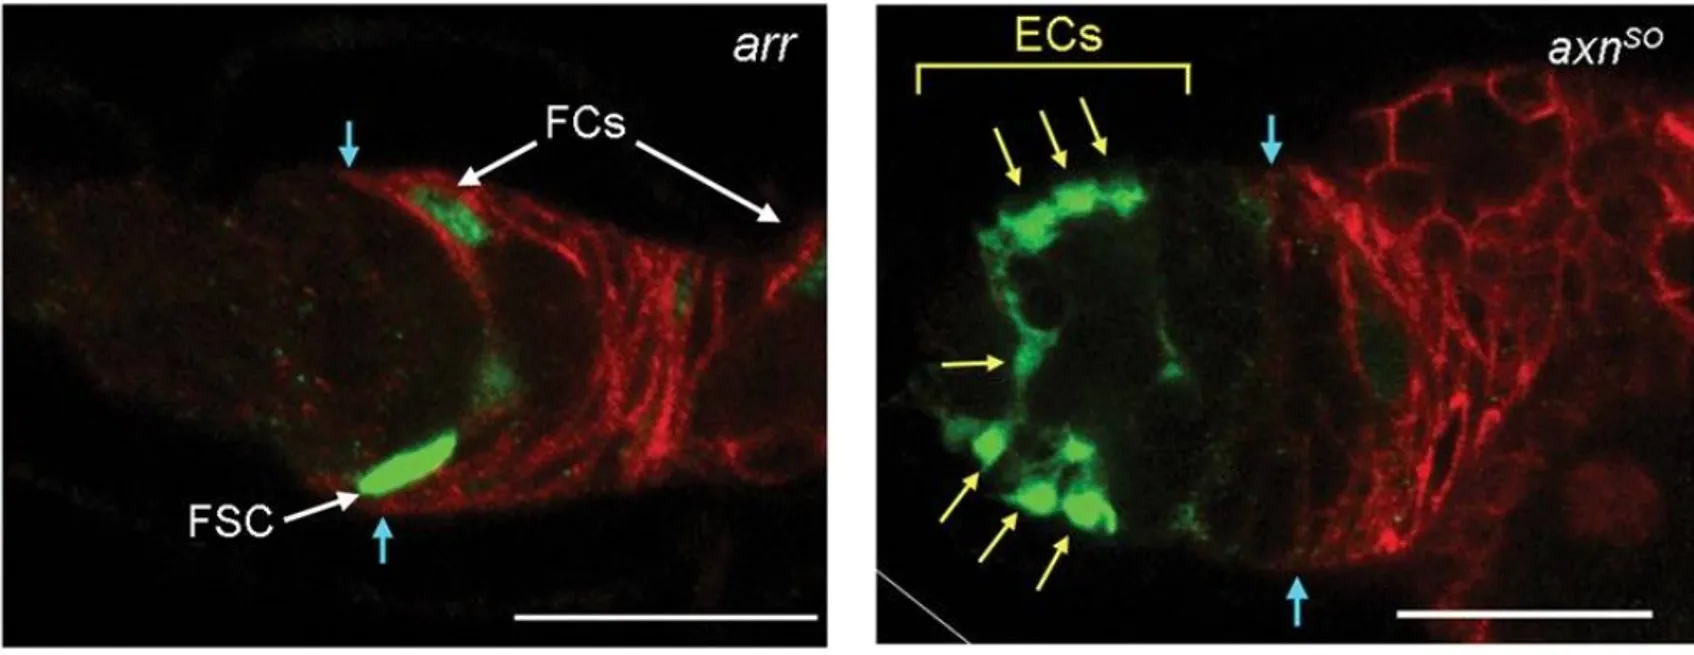
Loss of Wnt reception through arr shifts marked cells posteriorly and prevents escort-cell production; elevated signaling in axn mutants favors anterior positions and escort cells.
Research / Adult stem cells
Go beyond a snapshot of division.
Key idea
Knowing which phase changes helps explain how signals regulate proliferation.
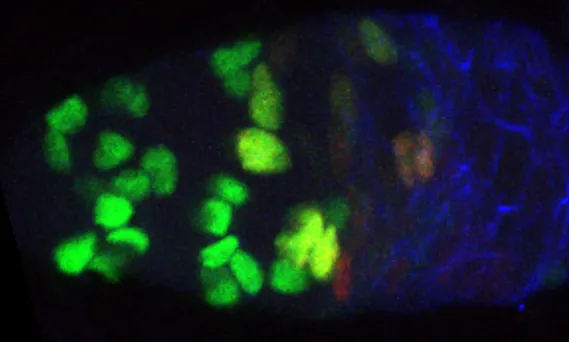
Reading cell-cycle state in tissue
What you are seeing
Differential E2F-GFP and CycB-RFP signals help distinguish cell-cycle phases in follicle stem cells and escort cells.
Image source
Reporter accumulation takes time: many S-phase FSCs lacked detectable fluorescence in the 2023 experiments. EdU labeling and live transitions were used to validate phase assignments. Green alone also does not distinguish a cycling G1 cell from a quiescent state.
What live cell-cycle measurements reveal
EdU marks DNA synthesis. Fly-FUCCI adds a view of cell-cycle phases using E2F-GFP and CycB-RFP reporters whose abundance changes as cells progress through the cycle.
Live imaging records reporter transitions and helps estimate phase durations. In the lab’s 2023 study, posterior layer-1 FSCs were estimated to cycle about 3.4 times as fast as layer-2 FSCs under the conditions studied. The larger difference than suggested by EdU fractions reflects different S-phase durations.Melamed et al., 2023: Spatial regulation of Drosophila ovarian Follicle Stem Cell division rates and cell cycle transitions
- G0 / G1
- GFP only.
- S phase
- RFP only, or neither reporter yet detectable.
- G2 / M
- Both reporters; cell shape identifies mitosis.
How to interpret Fly-FUCCI
The schematic shows idealized reporter colors.
The Fly-FUCCI reporter cycle
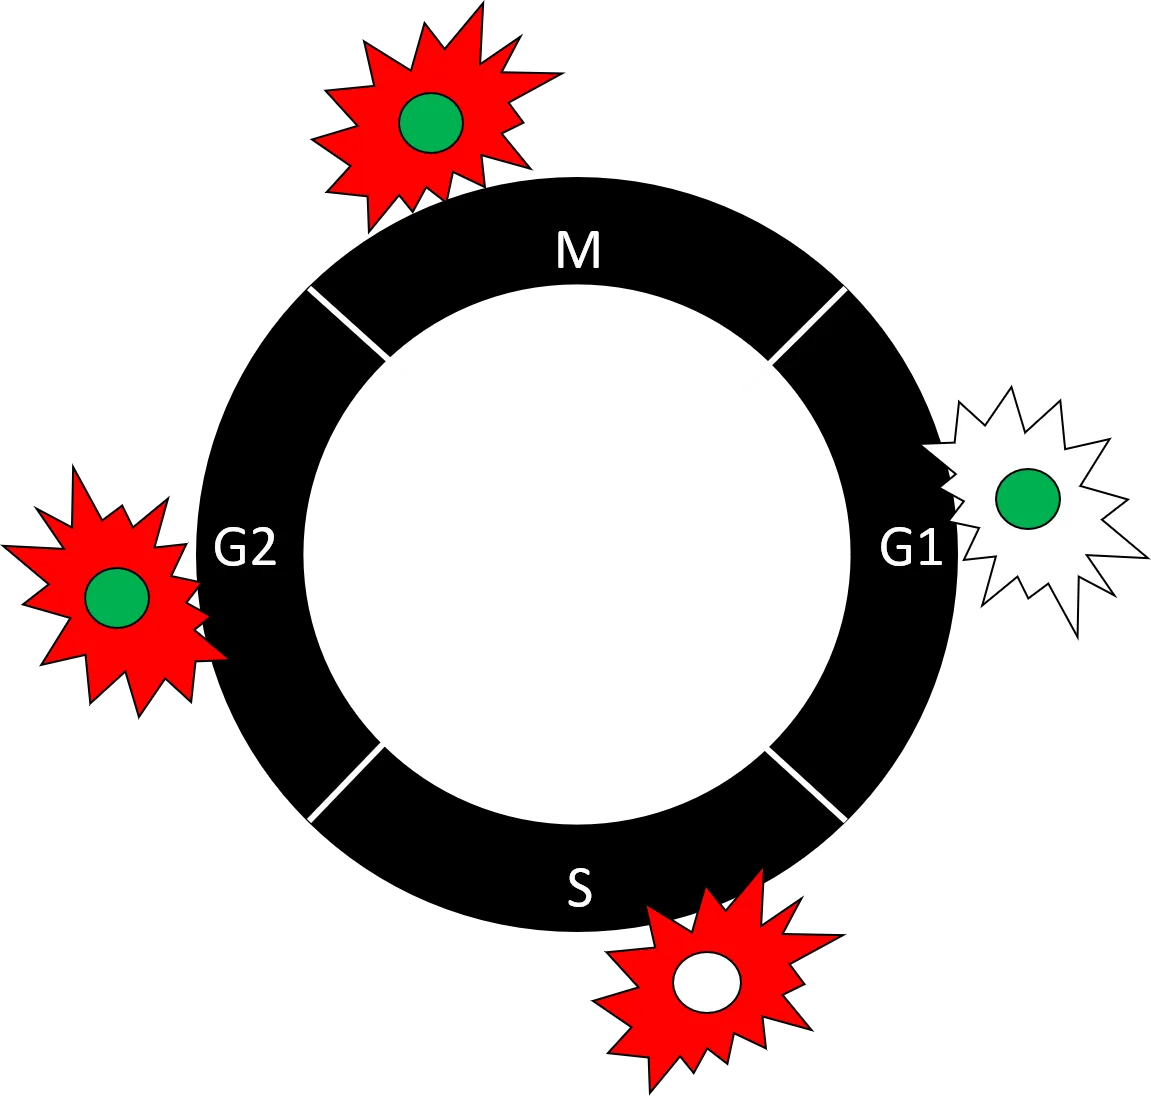
The original schematic shows the idealized reporter sequence. In FSC experiments, early S-phase cells may have neither detectable reporter; mitosis also needs morphological identification.
Research / Adult stem cells
Where does this community come from?
Key idea
Understanding adult renewal also means understanding how its stem cells and surroundings develop together.
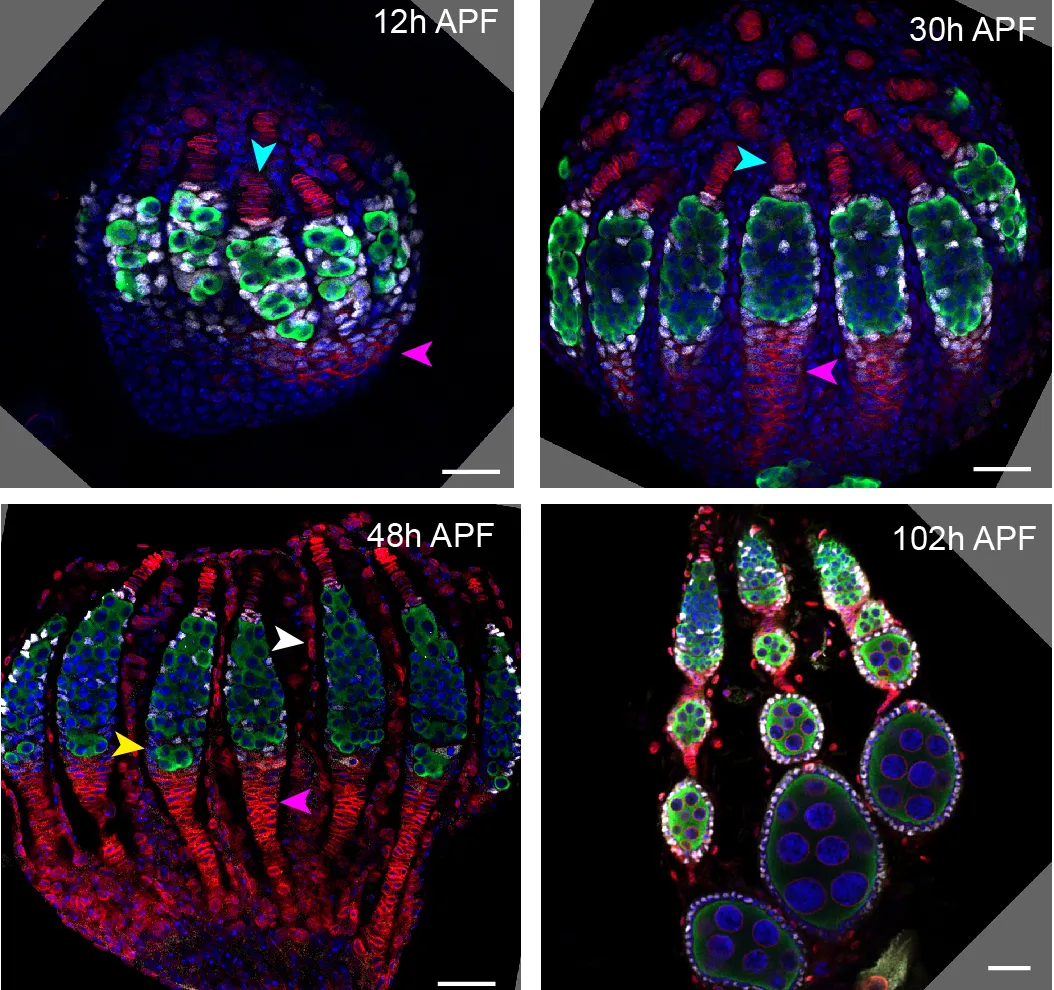
Building the adult ovary
What you are seeing
Vasa marks germline cells in green; Traffic Jam marks somatic precursors in white; DAPI labels nuclei blue. These are separate developmental samples.
Image source & panel notes
12 h APF Early somatic and germline organization, 12 hours after puparium formation.
30 h APF An intermediate stage in the assembly of the ovary at 30 hours APF.
48 h APF Developing ovariole organization at 48 hours APF.
102 h APF Late pupal organization at 102 hours APF, approaching the adult arrangement.
These stains reveal tissue organization. Lineage experiments are needed to establish what descendants individual precursors produce; a marker image alone does not prove a cell’s eventual fate.
What the lineage studies establish
The lab’s 2021 lineage study showed that escort cells, FSCs and follicle cells develop from shared somatic precursors during pupal ovary development.Reilein et al., 2021: Adult stem cells and niche cells segregate gradually from common precursors that build the adult Drosophila ovary during pupal development
The original time course samples 12, 30, 48 and 102 hours after puparium formation (APF).
The lab’s 2026 study extended this account by testing how positional signals and proliferation influence precursor outcomes. Its results support a shared regulatory framework for developing precursors and adult FSCs.Misner et al., 2026: Regulation of somatic stem cell development through positional and proliferative signals during Drosophila melanogaster pupal ovary development resembles the framework governing adult stem cell behavior
Read the developmental markers
Vasa identifies germline cells; Traffic Jam identifies the intermingled somatic precursors. The original blue arrowheads mark Lamin C-positive terminal filaments, while pink arrowheads mark Fas3-positive basal stalk cells. Lamin C and Fas3 are both shown in red.
Research / Adult stem cells
Explore the germarium in motion.
This player pairs live-imaging timepoints with their tracked BioVision reconstruction. It is a separate dataset from the fixed-sample lineage and developmental figures.
Locate this tissue in the fly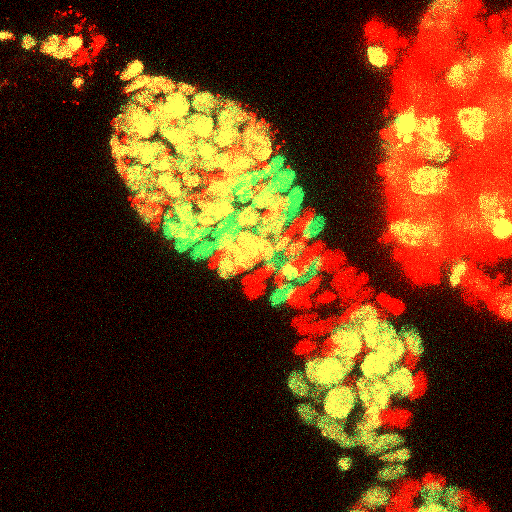
Microscopy paired with its BioVision reconstruction. The meshes are tracked segmented regions; source contour colors can repeat and do not identify cell type.
About this dataset
Source-paired BioVision reconstruction and lossless maximum-intensity microscopy projection at 31 biological timepoints, sampled every 531 seconds (8.85 min).
The orthographic 3D view shares the microscopy field. Biological time advances through the paired timepoints while camera rotation, pan, and zoom remain independent. Frame-to-frame movement is shown without artificial stabilization.
Research / Hedgehog signaling
From a developmental signal to gene activity.
Key idea
Preventing repression and activating transcription are distinct parts of the Hedgehog response.
Hedgehog helps developing tissues establish spatial patterns and also contributes to adult tissue maintenance. Disrupted signaling can cause developmental abnormalities and contribute to cancer.
In flies, the transcription factor Cubitus interruptus (Ci) carries much of the pathway’s output; its mammalian relatives are the Gli proteins.
Two responses to Hedgehog
Without Hedgehog
- Receptor
Patched (Ptc) restrains Smoothened (Smo).
- Processing
Full-length Ci-155 can be processed to the shorter Ci-75 repressor.
- Activity
Su(fu) and Costal 2 (Cos2) restrain the unprocessed Ci-155 that remains.
Target-gene activation is restricted.
With Hedgehog
- Receptor
Hedgehog binding relieves Ptc inhibition of Smo.
- Processing
Ci processing is reduced, limiting production of the Ci-75 repressor.
- Activity
Fused (Fu) kinase phosphorylates Ci to promote the activity of full-length Ci.
Activated Ci promotes Hedgehog target-gene transcription.
Simplified pathway overview. The 2025 study supports Fu-dependent activation without complete Su(fu) dissociation; the Ci-regulation experiments test the proposed mechanism.Kim et al., 2025: Hedgehog-stimulated phosphorylation at multiple sites activates Ci by altering Ci–Ci interfaces without full Suppressor of Fused dissociation
How the lab tests the pathway
The lab uses fly genetics to separate two responses to Hedgehog: reducing production of a Ci repressor and activating full-length Ci.
Research / Hedgehog signaling
How does Ci become an activator?
Key idea
Ci activation involves changes in protein interactions, beyond simply removing an inhibitor.
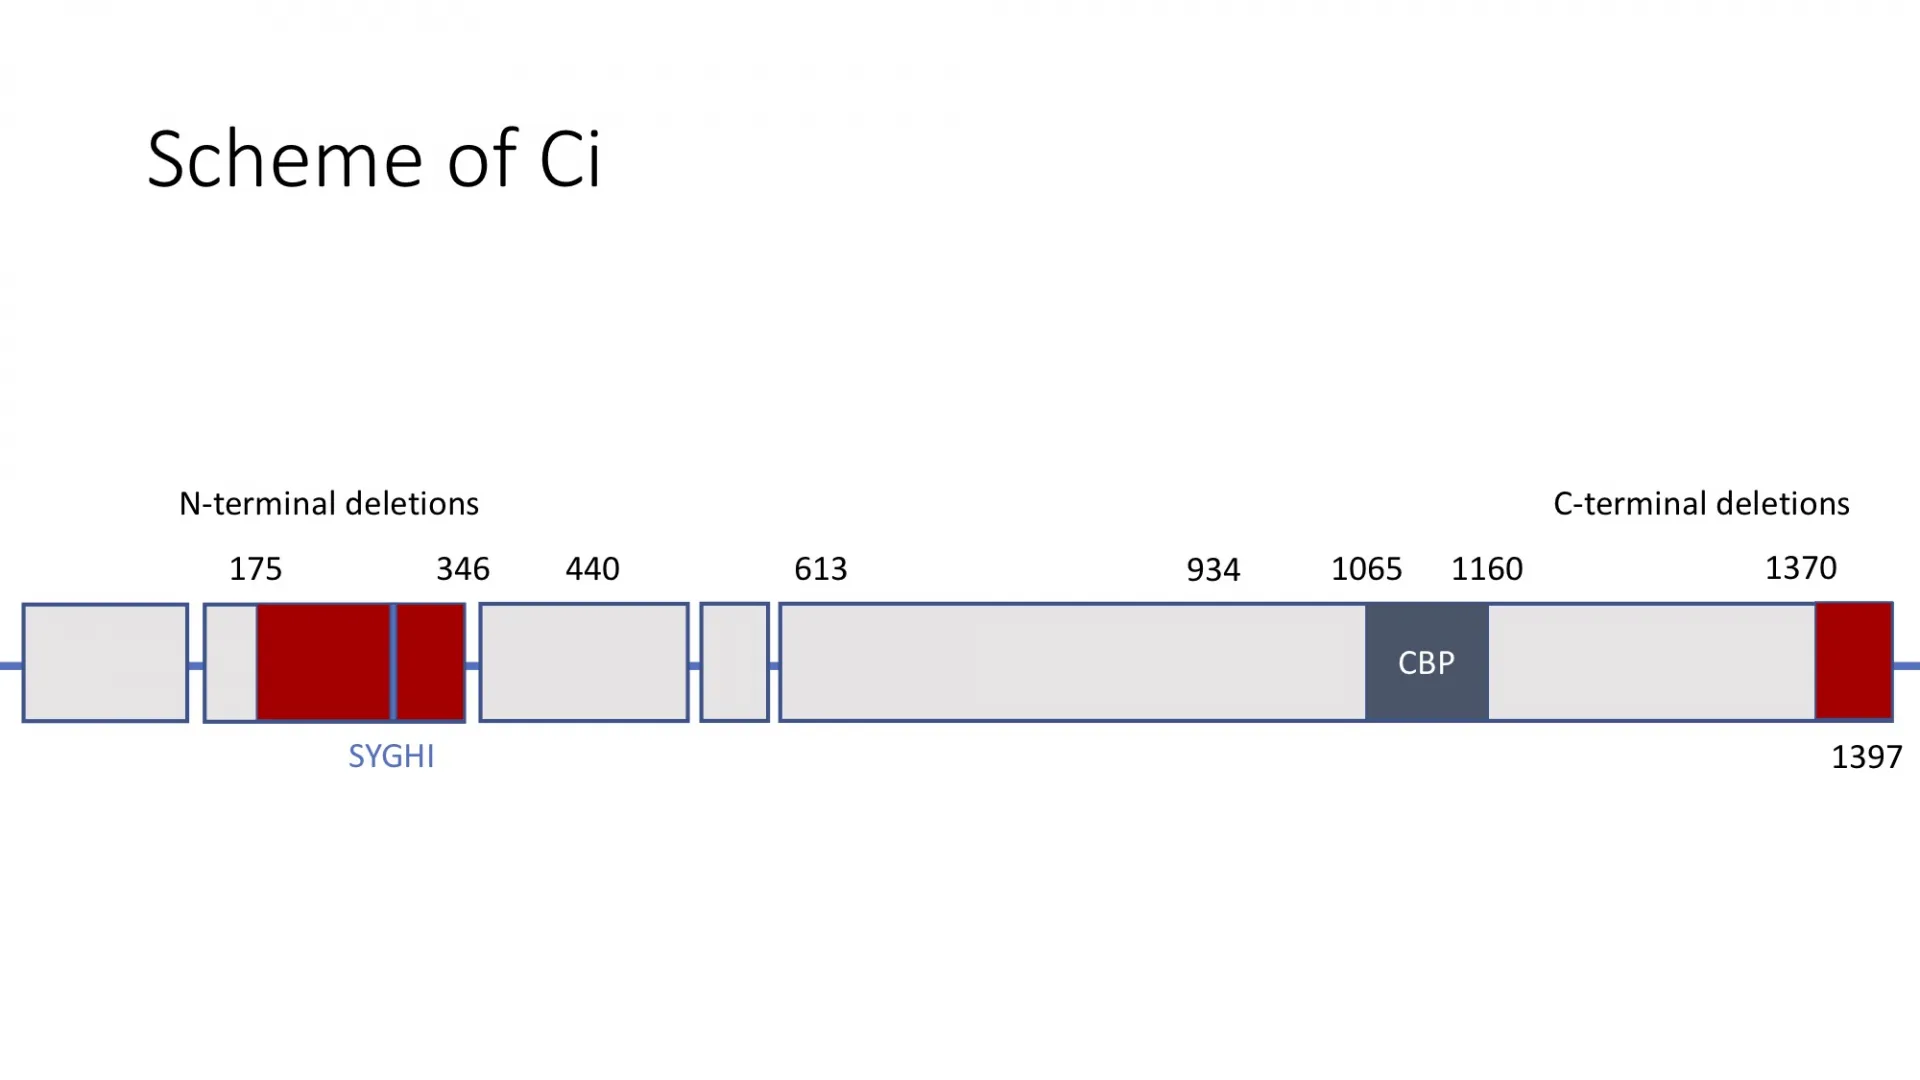
Mapping interactions along Ci
What you are seeing
The original domain map identifies regions tested for Su(fu) binding.
Image source
What the 2025 study proposes
The original research questions separate inhibition from activation: where does Suppressor of Fused (Su(fu)) bind Ci, how does it restrain Ci, and is direct phosphorylation by Fused required for activation?
The 2025 study tests this at the endogenous ci locus. Its proposed model places Ci–Ci interfaces at the center of regulation: phosphorylation at multiple sites promotes activation without requiring complete dissociation of Su(fu). Su(fu) binding also helps stabilize full-length Ci.Kim et al., 2025: Hedgehog-stimulated phosphorylation at multiple sites activates Ci by altering Ci–Ci interfaces without full Suppressor of Fused dissociation
Binding sites, inhibition and the questions behind the experiments
The original page set out three possible routes for Su(fu) inhibition: holding Ci in the cytoplasm, obstructing an activating partner, or recruiting a co-repressor. These are mechanistic questions, not three established, mutually exclusive answers.
Mutations in candidate binding regions and phosphorylation sites allow these ideas to be tested. The 2025 results support changes in Ci’s internal interfaces while much of its association with Su(fu) remains. They also show that Cos2 can assist Fu-dependent activation as well as restrain Ci without Hedgehog.Kim et al., 2025: Hedgehog-stimulated phosphorylation at multiple sites activates Ci by altering Ci–Ci interfaces without full Suppressor of Fused dissociation
Research / Hedgehog signaling
The wing disc turns position into a readout.
Key idea
A patterned tissue lets the lab compare pathway input, Ci regulation and gene output in place.
A gradient across the wing disc
What you are seeing
Hedgehog travels from the posterior compartment into anterior cells. The enlarged border illustrates different transcriptional responses to signal strength. The diagram is qualitative.
Image source & panel notes
Dpp The schematic places Dpp expression in a region responding to relatively low Hedgehog input.
Ptc Patched is both a receptor and a target-gene readout. Elevated Ptc reports a stronger Hedgehog response.
Anterior En Anterior Engrailed marks the highest response near the boundary. Its induction here differs from the posterior Engrailed that establishes compartment identity.
How to read the wing-disc response
The larval wing disc has anterior (A) and posterior (P) compartments. Posterior Engrailed helps establish Hedgehog production and suppresses Ci and Ptc expression there. Hedgehog moves into anterior cells, where its level varies with distance from the boundary.
Researchers read this response with target-gene expression and Ci protein staining. Ptc and anterior Engrailed report pathway output; full-length Ci-155 reports protein abundance and processing, which must be interpreted alongside transcriptional activity.
Research / Hedgehog signaling
Change Ci while preserving its context.
Key idea
Controlled genetic changes connect particular Ci regions to signaling behavior in living tissue.
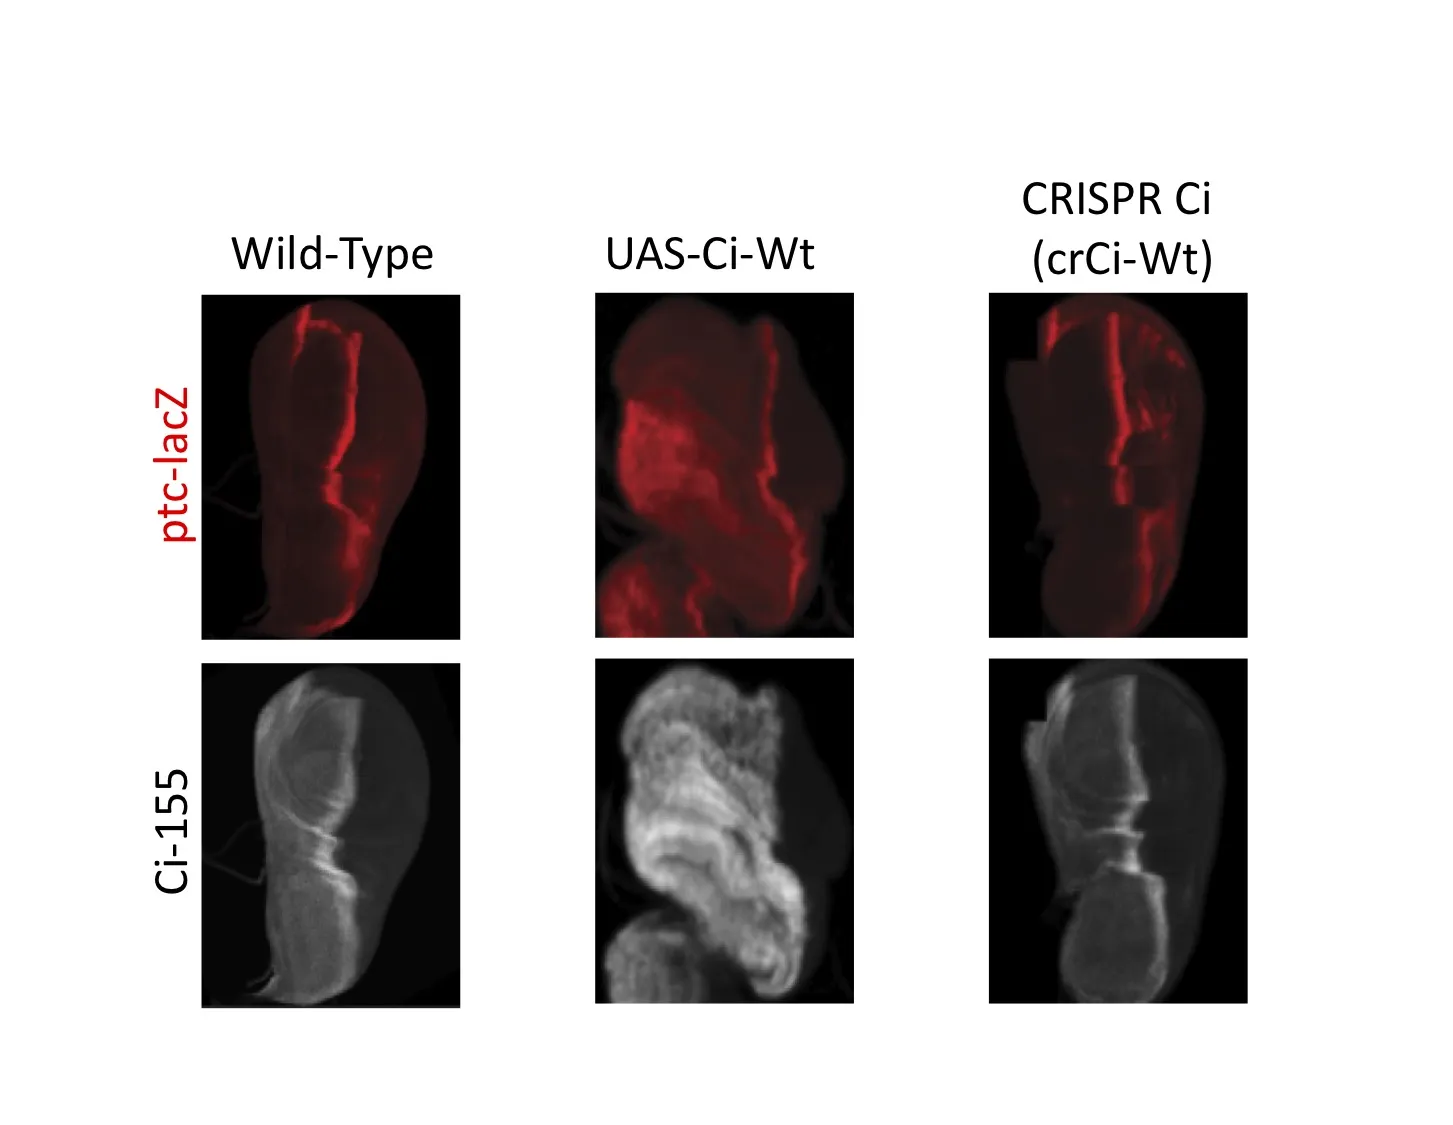
Ci expression in three experimental settings
What you are seeing
In these examples, UAS-Ci produces excess Ci and altered disc shape. Ci expressed from the edited endogenous locus more closely resembles wild type.
Image source
Why edit the endogenous ci gene?
UAS-driven expression is useful for manipulating a protein’s abundance, but excess Ci can complicate interpretation. Editing the endogenous ci locus with CRISPR/Cas9 allows selected mutations to be tested in its normal expression context.
In the original comparison, the CRISPR wild-type replacement resembles the unmodified wing disc more closely than UAS-Ci expression does. Researchers then combine edited ci alleles with other pathway backgrounds and examine Ci-155 and target-gene readouts.
Follow the two-round stock-generation workflow
Round 1 creates a marker-containing intermediate at ci. Round 2 replaces that intermediate with the intended ci sequence. The original scheme uses the mini-white eye-color marker to help identify the relevant editing steps; crosses establish a stable stock.
Edited males are crossed into selected genetic backgrounds, including wild type, Su(fu) or Fu mutants, Cos2 mutant clones, and activated Fu clones. Comparing the resulting wing discs tests which interactions are needed for inhibition or activation. The original figure records the experimental stock-building scheme.
Two rounds of genome editing
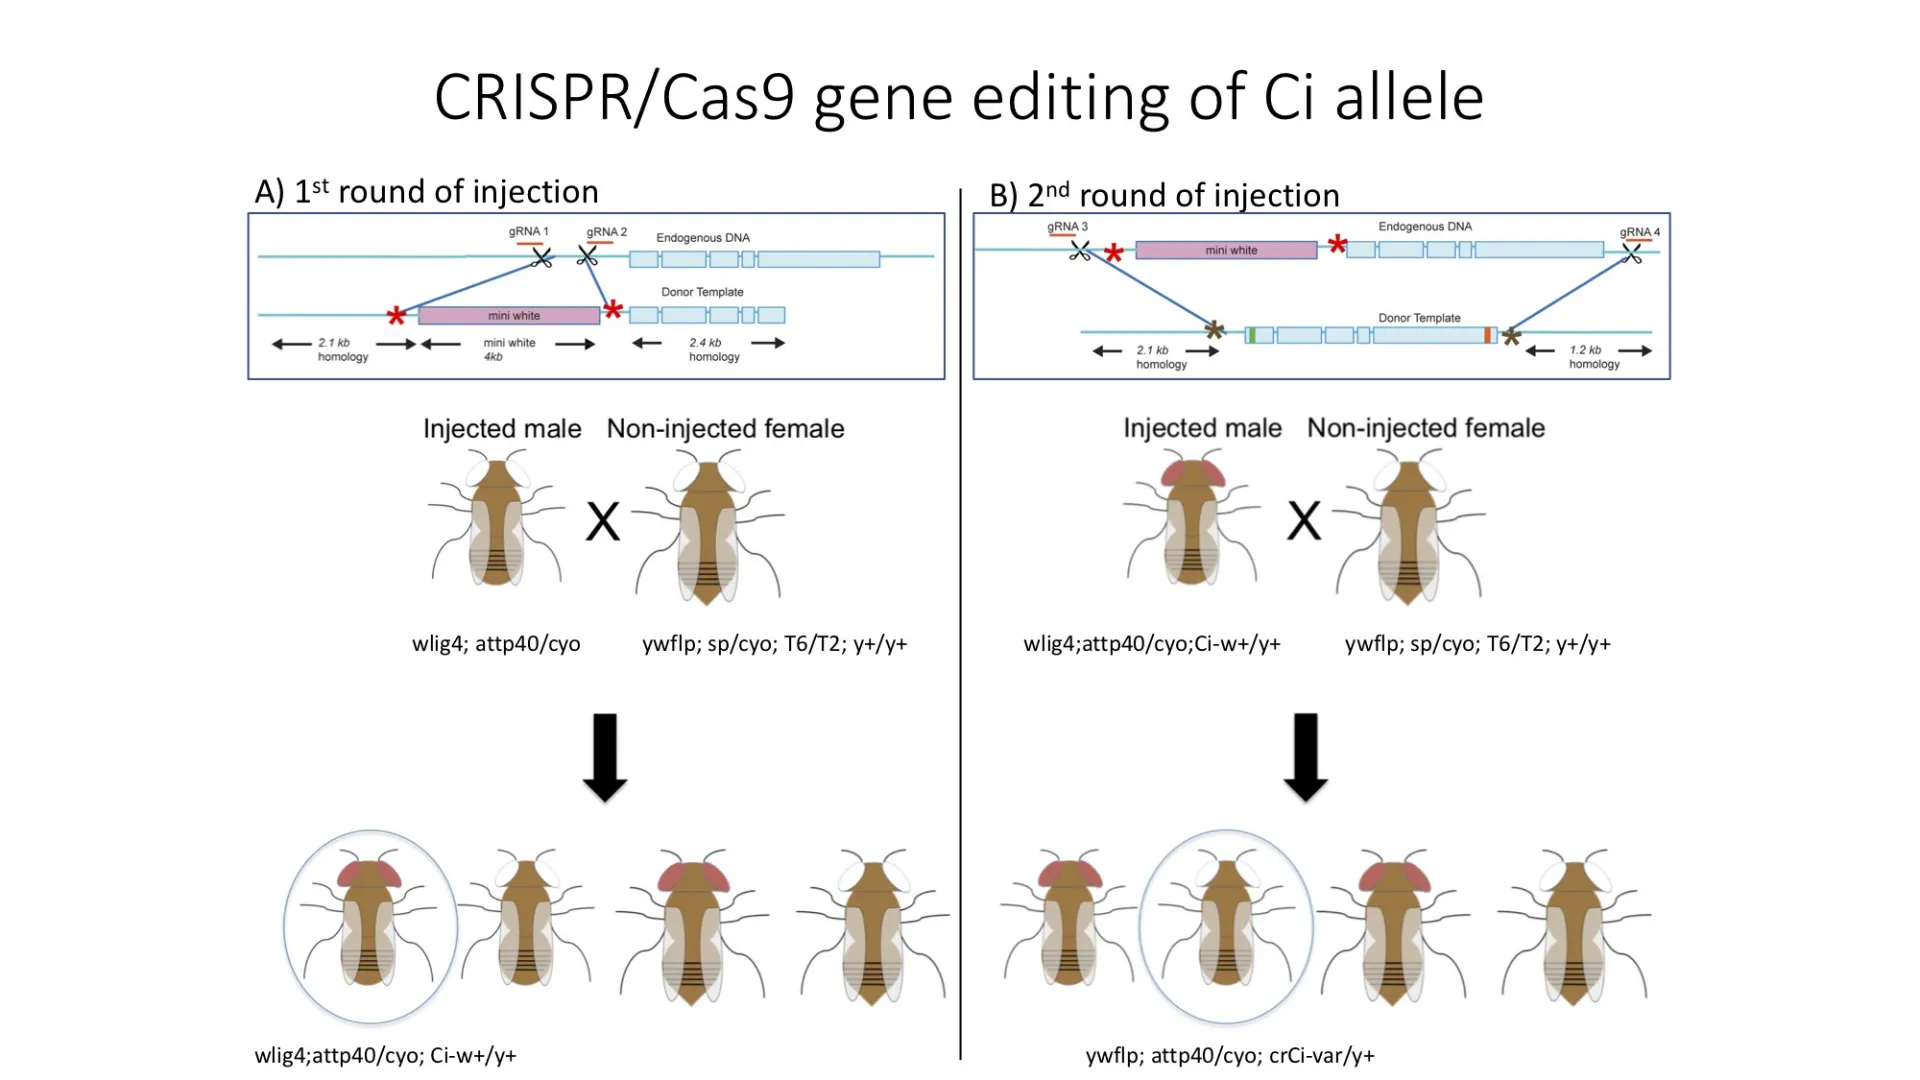
A marker-containing intermediate is made first; a second editing round replaces it with the intended ci sequence. Genetic crosses establish stocks for pathway tests.